
Andrew L. Berkin, PhD
Value stocks have been lagging their growth counterparts for some time now, and that difference has only widened. Through the 12 months ending March 31, 2020, the Russell 1000 Value Index (-17.17%) underperformed the Russell 1000 Growth Index (+0.91%) by 18.1%; in small cap stocks the gap was 11.1%.1 Over the past 10 years, that underperformance was 5.3% on an annualized basis in the large cap space (Russell 1000 Value Index minus Russell 1000 Growth Index) and 4.1% on an annualized basis with small caps (Russell 2000 Value Index minus Russell 2000 Growth Index). Some recent articles in the popular press proclaim that value investing may never recover its former long-term advantage, causing investors to wonder if they should shun value-oriented strategies.
There is a natural human tendency to abandon something that has not been working recently. In some situations, this may be the correct move. For example, children learn to be careful with fire after having been burned. Unfortunately, in investing there is evidence that such moves may be largely unsuccessful2, understanding that each individual investor’s suitability is very personal. As every piece of marketing material states, past performance is no guarantee of future results. That holds on the downside as well as the upside. So before abandoning any strategy, it is important to understand what is going on to drive that performance.
We at Bridgeway are firm believers in value. It is an integral part of our investment process. And despite its recent setbacks, we will continue to use it. Why? In my book with Larry Swedroe, “Your Complete Guide to Factor-Based Investing”, we look for a factor to be persistent, pervasive, robust, investable and intuitive. We found that the value factor meets those criteria for our portfolio construction process, and still find that to be the case today.
But wait, you may say, what about persistence? After all, value has been lagging for a while now. But we at Bridgeway are long-term investors, and it is important to take a long-term view on this issue. Consider the chart below, which shows the historical performance of various factors over different time horizons. All data is from Ken French’s data library3 for the longest history available. This data goes back to the 1920s for the market premium (Mkt-RF), small size (SMB), value (HML) and momentum (Mom). To interpret the data in the table below, each number represents the percentage of time each factor has outperformed for any given time period using monthly returns. For example, over any given one-year period since the inception of the data, the value (HML) factor has outperformed 61% of the time. The data presented shows all factors that have data available for the full duration beginning in July 1926 except for Momentum, which begins in January 1927. Growth is not an available factor in the Ken French data library, and therefore is not offered in the following table as a counterbalance to value. All data ends March 2020.
Percentage of Time of Outperformance for Various Factors as of 3/31/2020:
| Market (Mkt-RF) |
Size (SMB) |
Value (HML) |
Momentum (Mom) |
|
|---|---|---|---|---|
| 1 Year | 70% | 54% | 61% | 78% |
| 3 Years | 78% | 54% | 72% | 85% |
| 5 Years | 78% | 59% | 80% | 82% |
| 10 Years | 85% | 70% | 92% | 79% |
| 20 Years | 100% | 84% | 100% | 97% |
Source: Ken French Data Library http://mba.tuck.dartmouth.edu/pages/faculty/ken.french/data_library.html
A few things stand out. Over the long term, all of the factors have a positive chance of outperformance no matter the horizon. And as that time horizon lengthens, the percentage of time the factor outperforms tends to improve. But even over 10 years, every factor has had periods when it lagged. In fact, value has had the best track record of success over 10 years, even surpassing that of the stock market beating riskless T-bills. So the underperformance of value today is not unexpected, nor out of line with any other factor. And while some factors have never lagged over 20 years, that doesn’t mean it couldn’t happen in the future.
What might cause value to lag growth? A common saying among investment practitioners is that when growth is scarce, growth stocks will do well. While at first glance this statement may seem paradoxical, it is really just supply and demand. However, quantifying what is meant by growth is not necessarily so easy.
The approach I use below is an analysis by William Bernstein from the early 2000s4, which was the last time value underperformed growth over a 10-year period in the wake of the late 1990s Tech bubble. I have updated the analysis with more recent data to include the latest decade of underperformance of value. In this approach, Bernstein examined the relationship between value and inflation. The relationship is noisy on a monthly basis, but becomes clearer at annual horizons and is even more impressive when examined by decade.
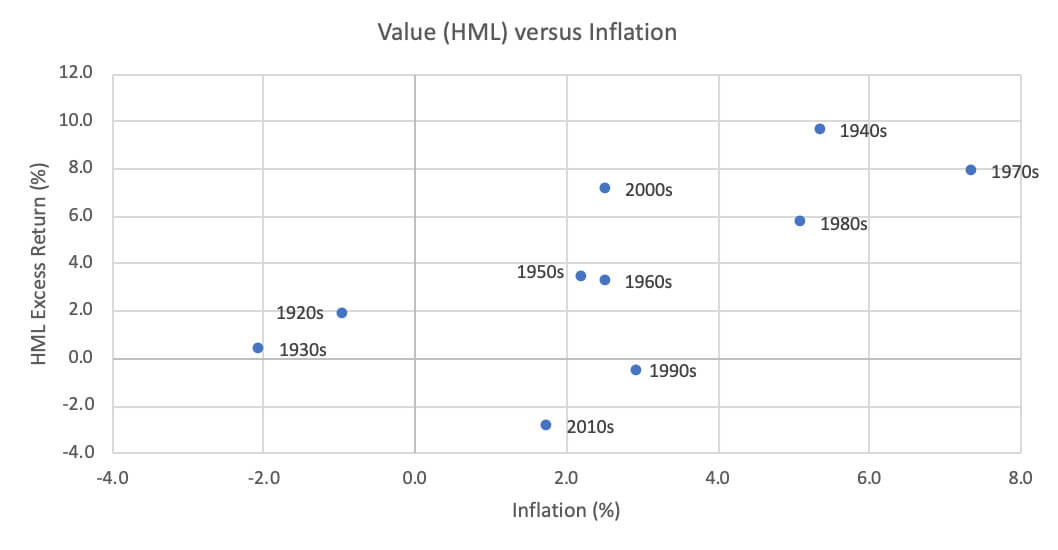
Source: Ken French data library, Federal Reserve Bank of St. Louis,
7/1926-12/2019 (most recent decade data available)
Historically, as inflation increases, value typically does better. In the world of equity investing, this is remarkably close to a straight line. The reason it is not perfectly straight is because inflation is not a perfect proxy for investors’ estimations of growth and other variables also influence value’s performance. On the first point, inflation and economic growth are certainly closely (although not perfectly) related. Greater growth in the economy ratchets up demand and increases inflationary pressures; the opposite happens with slow economic growth. What have we seen in the past ten years? Slow growth and low inflation coming out of the Great Financial Crisis, with the accompanying poor performance of value stocks.
This analysis is explanatory, rather than predictive. We know now what inflation was over the past decade. What about the next ten years? We can find reasons to be hopeful that economic growth will pick up. With the Fed having just cut interest rates and the government running annual deficits over a trillion dollars, extraordinary monetary and fiscal policy is trying to stimulate the economy. Given near zero interest rates and the recent stimulus package, strong growth could follow. But the real answer is that I don’t know what inflation will be over the next decade. And neither does anyone else. As Yogi Berra said, “It’s tough to make predictions, especially about the future.”
The second reason inflation doesn’t perfectly align with value is that other effects also determine how value stocks perform as a whole. Such effects include investors overpaying for growth stocks such that their value counterparts lag. Research by Bridgeway5 has shown that when factors like size and value lag the most, they do eventually rebound with very strong returns. Additionally, such underperformance tends to make these factors relatively cheap, which also leads to subsequent strong long-term returns. We cannot say when such a reversal will start and, as with all of this research, the effects of market disruptions such as the current COVID-19 pandemic is not yet fully known. But history tells us that such reversals have been very strong indeed for the factors such as value that we believe in and utilize. So, perhaps what value needs is some (economic) growth? Time will tell.
1 The gap between small cap growth and small cap value is represented by the return of the Russell 2000 Growth Index minus the return of the Russell 2000 Value Index.
2 See for example, “Absence of Value”, by Scott D. Stewart et al, Financial Analysts Journal 65(6), 34 – 51 (2009).
3 https://mba.tuck.dartmouth.edu/pages/faculty/ken.french/data_library.html
4 http://www.efficientfrontier.com/ef/701/value.htm
5 Contact us for more insights into our research in the value and size factors.
DISCLAIMER
The opinions expressed here are exclusively those of Bridgeway Capital Management (“Bridgeway”). Information provided herein is educational in nature and for informational purposes only and should not be considered investment, legal, or tax advice.
The Russell 1000 Growth Index measures the performance of the large-cap growth segment of the U.S. equity universe. It includes those Russell 1000 companies with higher price-to-book ratios and higher forecasted growth values. The Russell 1000 Growth Index is constructed to provide a comprehensive and unbiased barometer for the large-cap growth segment. The Index is completely reconstituted annually to ensure new and growing equities are included and that the represented companies continue to reflect growth characteristics.
The Russell 1000 Value Index measures the performance of the large-cap value segment of the U.S. equity universe. It includes those Russell 1000 companies with lower price-to-book ratios and lower expected growth values. The Russell 1000 Value Index is constructed to provide a comprehensive and unbiased barometer for the large-cap value segment. The Index is completely reconstituted annually to ensure new and growing equities are included and that the represented companies continue to reflect value characteristics.
The Russell 2000 Growth Index measures the performance of the small-cap growth segment of the U.S. equity universe. It includes those Russell 2000 companies with higher price-to-book ratios and higher forecasted growth values. The Russell 2000 Growth Index is constructed to provide a comprehensive and unbiased barometer for the small-cap growth segment. The Index is completely reconstituted annually to ensure new and growing equities are included and that the represented companies continue to reflect growth characteristics.
The Russell 2000 Value Index measures the performance of the small-cap value segment of the U.S. equity universe. It includes those Russell 2000 companies with lower price-to-book ratios and lower expected growth values. The Russell 2000 Value Index is constructed to provide a comprehensive and unbiased barometer for the small-cap value segment. The Index is completely reconstituted annually to ensure new and growing equities are included and that the represented companies continue to reflect value characteristics.
It is not possible to invest directly in an index.
Mkt-RF or the equity risk premium is the expected excess return of the market portfolio beyond the risk-free rate. SMB or the size premium measures the additional return investors have historically received by investing in stocks of companies with relatively small market capitalization. HML or the value premium measures the additional return investors have historically received for investing in companies with high book-to-market values. Mom or the momentum premium measures the additional return investors have historically received for investing in companies with positive acceleration in stock price.
Before investing you should carefully consider the Bridgeway mutual funds’ investment objectives, risks, charges and expenses. This and other information is in the prospectus, a copy of which may be obtained by calling 1-800-661-3550 or visiting the Funds’ website at www.bridgeway.com. Please read the prospectus carefully before you invest.
Investing involves risk, including possible loss of principal. In addition, market turbulence and reduced liquidity in the markets may negatively affect many issuers, which could adversely affect the mutual funds. Value stocks as a group may be out of favor at times and underperform the overall equity market for long periods while the market concentrates on other types of stocks, such as “growth” stocks.
The Bridgeway mutual funds are distributed by Foreside Fund Services, LLC, which is not affiliated with Bridgeway Capital Management, Inc. or any other affiliate.